 Business Brain


Case Studies
Client Results From First Party Analytics
From annual set sales up 26% for one client to organic Google clicks from 2,261 to 15,012 for another.
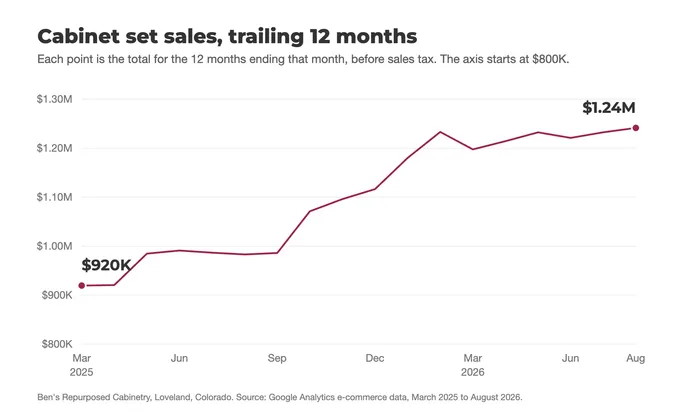
Cabinet set sales, before sales tax
- Sep 2024 to Aug 2025: $983K
- Sep 2025 to Aug 2026: $1.24M
Ben's Repurposed Cabinetry. Source: Google Analytics.
Ben's Repurposed Cabinetry, Loveland, Colorado
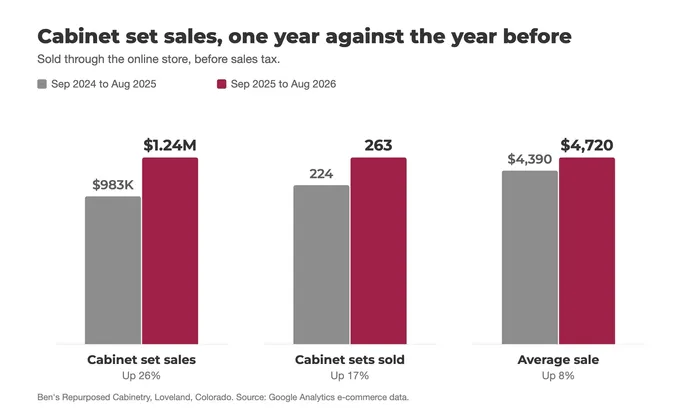
Cabinet Set Sales Up 26% in One Year

Ben's Repurposed Cabinetry sells full sets of used kitchen cabinets through its online store. From September 2025 to August 2026 the store sold 263 sets for $1.24 million before sales tax, up from 224 sets for $983,000 in the 12 months before that. The average set sold for about $4,720, up from about $4,390.
Most of that gain came in the first 6 months. From September 2025 to February 2026 the store sold 128 sets, up from 89 in the same months a year earlier. From March to August 2026 it sold 135, the same number as the year before.
Everything paid through the checkout, cabinets plus delivery and other charges, came to $1.49 million, up from $1.06 million. The store only began taking most of those other charges online in 2025, so the cabinet numbers are the fair comparison.
The charts
Cabinet Set Sales, Charted
Both charts are built from the store's Google Analytics e-commerce data, before sales tax.
The result
12 Months Ending August 2026
Compared with the 12 months before.
26%
More cabinet set sales in dollars
263
Cabinet sets sold, up from 224
$1.24M
In cabinet sets, up from $983,000
How We Measured It
Google Analytics e-commerce data from the store's own checkout, for the 12 months ending August 2026 compared to the 12 months ending August 2025. Five orders that Analytics recorded twice are counted once. All figures are before sales tax, and refunds are not subtracted. August 2026 is the last full month before the store moved to a new website.
Health app
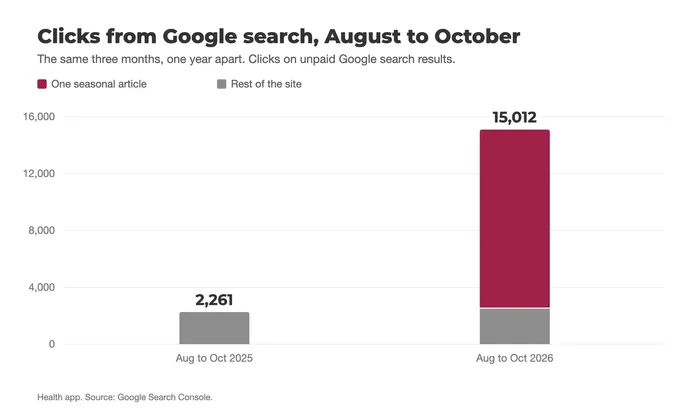
One Article Took Google Clicks From 2,261 to 15,012
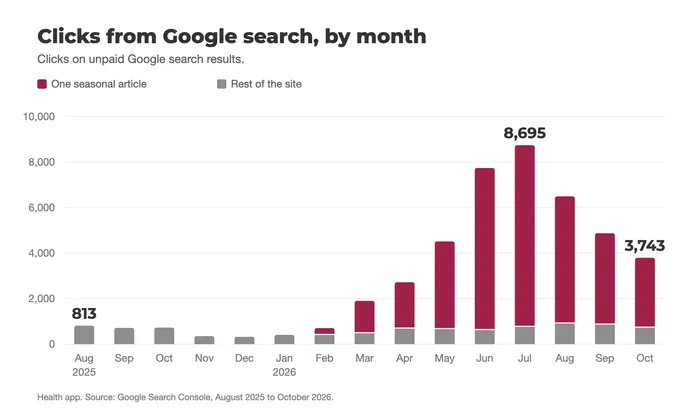
From August to October 2025 this health app's website got 2,261 clicks from Google search. In the same 3 months of 2026 it got 15,012, which is 6.6 times as many.
One seasonal article brought in 12,521 of those 15,012 clicks, up from 40 a year earlier. The rest of the site grew 12%, from 2,221 clicks to 2,491.
Monthly clicks for the whole site peaked at 8,695 in July 2026 and have come down each month since, which we expect from a summer topic. October 2026 still had 3,743 clicks, 5 times the 732 of October 2025.
What we did: We reworked that article and designed the final version of the page.
The charts
Google Clicks, Charted
Both charts are built from the site's Google Search Console data.
The result
Google Search, One Year Apart
August to October 2026 compared with August to October 2025.
15,012
Google search clicks, up from 2,261
12,521
Of those clicks went to one article
12%
Growth across the rest of the site
How We Measured It
Google Search Console, which counts clicks on unpaid Google search results. These are clicks to the site. Sign-ups and sales are not part of the count. The 2025 figures come from the earlier version of the site, before it moved to new addresses in late 2025.
Ecommerce site
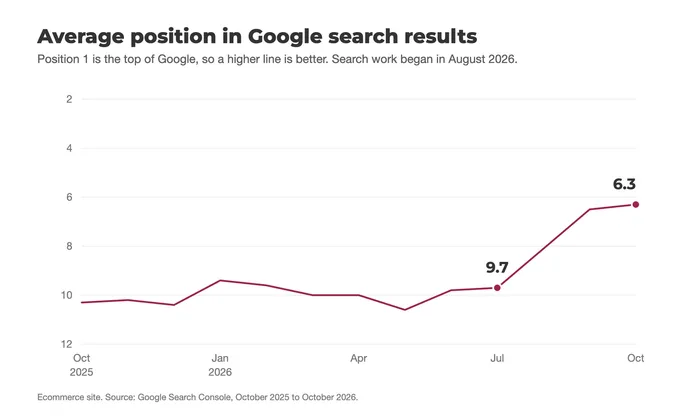
Average Google Position Improved From 9.7 to 6.3 in 3 Months
In August 2026 we started work to help this company's online store show up higher in Google search. Average position is how far down Google's list the site's results sit, averaged over every search where one of its pages appeared, and position 1 is the top. From October 2025 to July 2026 the site's average position stayed between 9.4 and 10.6. It was 9.7 in July 2026 and 6.3 in October.
Most of that movement is on the product pages. Their average position went from 9.1 to 5.7, and Google showed them 50% more often in October than in July. Clicks to those pages have not moved yet, with 168 in October and 158 in July.
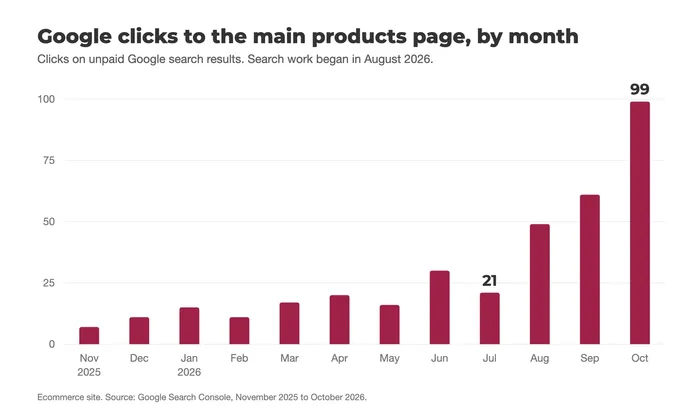
The main products page, which lists the company's product categories, shows the clearest gain so far. It got 67 clicks from Google from May to July 2026 and 209 from August to October, with 99 of those in October. It had been growing slowly before August and grew faster after.
Clicks across the whole site are still behind last year. From August to October the site got 6,359 clicks from Google against 7,129 in the same months of 2025, which is 11% fewer. It was already 15% behind in the last 3 weeks of July, before any of the work was live. In the first 10 days of November it got 822 clicks against 778 a year earlier. That is a short stretch, and the 28 days ending November 10 were still 4% behind.
The work is about 3 months old and still under way, so these are early numbers. December was this company's biggest month for Google clicks last year, and we'll update this page after the holiday season.
What we did: Product information came first, in August 2026. Other page updates followed in late August and late September.
The charts
Google Position and Clicks, Charted
Both charts are built from the site's Google Search Console data.
The result
Google Search, 3 Months In
Search work began in August 2026 and is still under way.
9.7 to 6.3
Average Google position, Jul to Oct 2026
209
Clicks to the main products page, up from 67
50%
More Google showings of product pages, Oct against Jul
How We Measured It
Google Search Console for the company's website, read on November 12, 2026. It counts clicks on unpaid Google search results and reports the average position of the site's results. These are clicks to the site. Sales are not part of the count. The position chart starts in October 2025 because Google changed how it counts search results in September 2025, and earlier positions cannot be compared with later ones. The July comparison uses July 11 to 31 in both years, because July 11, 2025 is the earliest date on record.
